Thursday, 19 November 2015

Key findings from the 2015 Joint Monitoring Program update and MDG assessment.

The 2015 JMP update and MDG Assessment.
Credit: UNICEF/WHO 
The Joint Monitoring Programme for Water Supply and Sanitation (JMP) run by the WHO and UNICEF was responsible for the monitoring of progress towards the Millennium Development Goals (MDG). Earlier this year they released the latest estimates on sanitation and drinking water at the end of the MDG era with reports on progress from 1990-2015. In my last blog I was relatively critical of metrics relating to access. Nonetheless, the report presents the latest findings on urban water and sanitation and therefore it makes sense to do a short short blog outline the key findings.
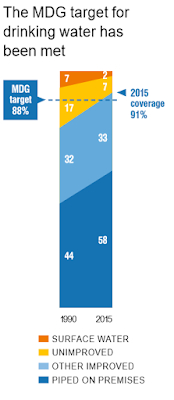
Figure 1: Use of improved drinking water sources
and MDG target in 2015, and  percentage point
  change from 1990 to 2015,
Source: UNICEF/WHO 


Drinking Water
  • 91% of the global population now uses an improved drinking source up from 76% in 1990 at the start of JMP. This figure is 96% for urban areas.
  • The global target for the MDG was met in 2010, 5 years ahead of the deadline, with 2.6 billion people having gained 'access' to an improved source since 1990.
  • However, in 2015 633 million people still lack access to improved drinking water sources and this figure may well be higher if you question what 'access' really means. As figure 1 shows, five developing regions met the drinking water target. Yet, of the five that didn't, two were within Africa: Northern Africa and sub-Saharan Africa.


Sanitation
  • Improvements in sanitation were much lower than those for drinking water. The MDG target was missed by almost 700 million with just 68% of the global population using improved sanitation facilities compared to 54% in 1990 - a modest improvement nonetheless.
  • The figure for urban areas is now much higher at 82%.
  • Out of the four developing regions that met the sanitation target two were within Africa: Northern and Western Africa. However as figure 3 shows, somewhat alarmingly, limited or no progress dominated in the majority of Africa.
  • However discussed in my third blog, economic factors seem to play a major role in determining access, with none of the least developed regions reaching the sanitation target and only 27% of their population gaining access since 1990. 
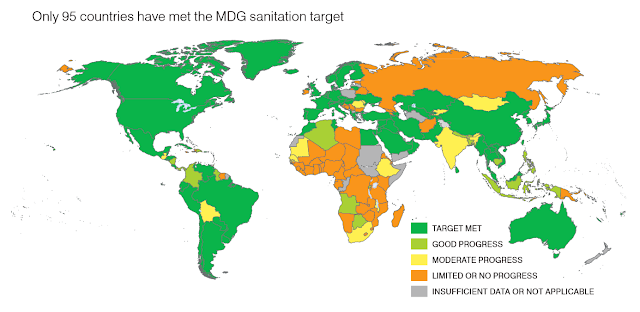
MDG target achievement for sanitation, Source: UNICEF/WHO

Equality:

One of the most interesting findings is that multiple inequalities have been found to exist based on wealth and location on a variety of scales. Figure 4 shows the 'equality tree'  for access to piped water created for the JMP (2015). Inequalities exist between regions of the world (first branch), countries within a certain region (second branch), between urban and rural areas within a country (third branch - in this case Kazakhstan but the same pattern would remain within Africa), and between the richest and poorest in respective rural and urban areas (fourth branch). Figure 4 also shows that the poorest fifth of the rural population within Kazakhstan have the same levels of piped water coverage as sub-Saharan Africa.

The 'Equality tree' for access to fresh water, Source: UNICEF/WHO


Access? Really..??

In my previous two blogs I outlined the factors which are responsible in determining access to renewable fresh water resources in urban areas, both physical and socioeconomic. However, what does access really mean? Is it equivalent to the availability and access that I am used to in London on a daily basis?

Figure 1: Trends in global drinking
water coverage and MDG target (%),
1990-2015. Source WHO/UNICEF (2015)
 The WHO/UNICEF Joint Monitoring Program for Water Supply and Sanitation (JMP), which began in 1990, is rightfully proud of global achievements on sanitation and drinking water in the time it has provided estimates of progress towards the Millennium Development targets. In its 2015 update and MDG assessment  it was able to report (fig. 1) that 91% (up from 76% in 1990) of the global population now uses an improved drinking water source with the global MDG target for drinking water met back in 2010, 5 years ahead of the deadline. An impressive 2.6 billion people have gained access to an improved drinking water source since 1990. However, in 2015, 663 million people still do not have access to improved drinking water sources.

Access to safe water as defined by the JMP in the early 1990s is the proportion of population with access to an adequate amount of safe drinking water located within a convenient distance from the user's dwelling (UNICEF/WHO, 2015). Interestingly the words in bold (and placed in small print) are defined at a country level. However the WHO suggest when no definitions are available at the country level the following definitions may be used (WHO, 1996):

  1. Access to water: In urban areas a distance of not more than 200m from a home to a public standpost may be considered reasonable access. In rural areas, reasonable access implies that the housewife does not have to spend a disproportionate part of the day fetching water for the family's needs.
  2. Adequate amount of water: Twenty litres of safe water per person per day. (For reference average water use ranges from 200-300 liters per person per day in most European countries (UN, 2014)).
  3. Safe water: Water that does not contain biological or chemical agents directly detrimental to health. It includes treated surface water and untreated but uncontaminated water from protected springs, bore-holes, sanitary wells, etc.
  4. Convenient distance: In urban areas, to fetch 20 liters of safe water per person per day, 200 meters would be a 'reasonable' distance from the home.
On the 28th of July 2010 the United Nations explicitly recognized the human right to water and sanitation. However issues of access again prevail. Sufficiency is defined as a slightly higher 50 to 100 litres per day. Although everyone has the "right to water and sanitation service that is physically accessible" (UN, 2014), the source only has to be within 1000 metres of the home and collection time should not exceed 30 minutes. This surely cannot be called accessible?

Examples of issues surrounding access within academic literature are common. For instance within urban areas in East Africa, the Drawers of Water 2 study (Thompson et al. 2000) found  that a deterioration of piped water supplies occurred between 1967 and 1997 resulting primarily form a lack of system maintenance. Access still remained as defined by unicef/WHO, however true access declined as represented by a significant reduction in per capita water usage for piped households from 120.4 litres to 64.2 per day. 

Furthermore, the unpredictability of piped water supply in Urban East Africa has forced households to mitigate. This is exemplified through the number of households who are storing water at home (increasing from only 3% in 1967 to 90% in 1997), in addition to their piped supplies to cater for shortages and intermittent failures (Thompson et al. 2000). Taylor (2004) reports that rapid urbanisation in east and southern Africa has overwhelmed many urban, piped supplies, forcing consumers to draw water from a mix of source throughout the year undermining true access. Similar findings have also been echoed in studies of Urban Uganda (Howard et al. 2002). True access is again debatable.

The growing demand for water in urban areas has also lead to a significant rise in private water-vending. Although this can be received positively though increasing convenience and reliability, (Thompson et al. 2000) suggest that it can be detrimental leaving households with limited choice, with rising costs closely linked to declining per capita consumption. For unpiped households, sources of water range from unprotected or surface sources through protected improved sources and private sources such a vendors. Even through protected sources are associated with accessibility, the Drawers of Water paper highlights how they are susceptible to technical failures, facing high demand and steep competition.

Water accessibility measures also fail to take into account issues surrounding collection times. Within a study in rural Ethiopia (different characteristics from urban areas, but still important nonetheless), during drought conditions collection times increased to 9 hours in places. Even within the wet season collections times are significant at 1-2 hours. Furthermore, the main constraint reported by poorer households was their inability to release labour for water collection accentuated by seasonal variability in water resources (Tucker et al. 2014). Although use of water for drinking and cooking does not decline in the dry season, water used for personal health and hygiene was found to be forfeited. Although water may be fundamentally available it is not accessible in reality as other significant costs are incurred, impacting the poorest households the hardest. In addition, the study also tackled the assumption that just because an improved resource is available it will be used preferentially. However, the study found that poorer households are more likely to choose an unimproved source over a more expensive protected source highlighting again how definitions of accessibility do not take into account the true reality of life on the ground. Finally, hidden within metrics of accessibility is the exacerbation of issues of gender inequality. Household collection is primarily conducted by women, and they are therefore preferentially effected with Swahili proverb stating that women are water - mwanawaki ni maji (Taylor 2004).

All these variables undermine definitions of water accessibility. Although significant improvements have been made in water availability and accessibility over the last 20 years, as the JMP recognizes, much still remains to be done. However, as I hope this blog begins to set out the problem is even greater than the JMP report outlines. This is fundamentally because definitions of accessibility hide a significant number of problems that are still at large. It is a lot easier to improve accessibility figures if you do not raise the bar high enough. At the moment access by no stretch of the imagination means full access, to the extent that people deserve as a fundamental human right.


Monday, 9 November 2015

Access to water in urban areas - Part 2

Last week I blogged about the importance of physical factors in determining renewable water resource availability and access within urban areas in Africa. In this blog I am turning to socio-economic/ political factors.

Although I previously stressed the importance of water resource availability, figure 1 shows the relationship between the percentage of the population with access to an adequate amount of safe water (a) and access to sanitary facilities (b) against renewable freshwater resources available for selected African nations. It is apparent that there is in fact, on a holistic level, no real relationship between the two variables with the trend lines in fact suggesting a negative linear relationship. Egypt and Algeria (fig. 1a), the countries with the highest access to safe water have very low renewable water resources, 34 and 442 cmpc (cubic meters per capita) respectively. Madagascar and the Democratic Republic of the Congo have water resources of 21139 and 18101 cmpc yet access of just 47% and 45%.  

Figure 1: a) The relationship between access to safe water and renewable fresh water resource, b) access to sanitation and renewable freshwater resources. Data source: *

Figure 2 shows percentage access to safe water (a) and sanitation (b) against GDP per capita. The relationships appear statistically stronger with both access to water and sanitation showing similar positive linear trends. As GDP increases so does access with comparatively wealthier countries appearing to have greater access. For access to water in particular there appears to be a threshold of around $900 after which the highest levels of access are observed. This data suggests that rather than physical factors and the availability of renewable resources, access is instead determined by socio-economic conditions


Figure 2: a) Th e relationship between access to safe water and GDP per capita. b) access to sanitation and GDP per capita. Data source: *
A study in the early 2000's revisited earlier work on urban water use in East Africa (Drawers of water) providing analysis on changing usage patters over a 30 year period (Thompson et al. 2000). The paper found the most important factor affecting urban water use was whether or not households had access to a functioning piped system. Thus, in 1967 (fig. 3) those who access to piped sources consumed on average 124.3 litres per day whereas those without a piped source used only 15.4 litres. By 1997 the consumption gap between piped and unpiped sources had narrowed significantly. Although this may appear positive it is in fact mainly as a result of declining per capita water usage in piped households to 64.2 litres although unpiped usage did increase slightly to 24.3 litres per day. The changes in daily per capita water usage were not as a result of changing availability of renewable freshwater resources or physical factors or major improvements in unpiped systems. Instead the authors argue that the closing consumption gap is mostly a consequence of the collapse of municipal piped systems. A similar story is found with the reliability of piped supplies with in 1967 practically all piped households receiving 24 hour access. In 1997 this had fallen to only 56%. This is again blamed on socio-economic factors such as lack of system maintenance and increasing stresses on existing network capacity. Considering the scale of additional stresses resulting from a rapidly growing population, the authors finish by underlining the importance of governance in ensuring access to water again echoing the importance of socio-economic and political factors.

Figure 3: Per capita water used by type (litres per day). Source: Thompson et al. (2000)

Although the fundamental availability of freshwater resources is dependent upon physical factors and the distribution of freshwater resources, this blog has has highlighted the idea that there are equally important relationships at play. The relationship between socio-economic and political factors and access. These ideas I will focus in on in much greater detail in some of my future blogs. However, my next blog aims to look behind the metrics. I will investigate what access to water really means and whether the term 'access' is in fact rather misleading.

* Data sources:  World Resources Institute (2000); Population, Resources, Environment and Development Databank (v. 3.0), United Nations ESA/P/WP.170 (January 28, 2002)

Friday, 30 October 2015

Access to water in urban areas - Part 1

Lusaka, the capital of Zambia. A fast growing urban area within Africa
with the fortune of an underlying plentiful and accessible aquifer.
Note the plenitude of pivot irrigation to the north of the city.
Credit: Google maps.

In my last post I provided some context surrounding urban water and sanitation within Africa. What became clear was that there is a large degree of geographical variation on a multitude of scales in the provision of improved drinking water sources in urban areas.

In Layman's terms if there were adequate availability and equal distribution of fresh water across Africa, issues of urban water and sanitation, scarcity and stress would not be a problem. Now this is a gross simplification, but allows for the purpose of this blog to break down the issues at hand. This blog will focus on physical factors, recognising the importance of the availability and distribution of freshwater resources whereas my next blog will analyse the socio-economic factors which limit access in urban areas.

As eluded to already and reported by Conway et al. (2009), rainfall and river flows over the whole of the African continent display high levels of variability over a range of spatial and temporal scales with significant implications for society causing widespread acute human suffering and economic damage. Examples of variability include multi decadal anomalies in river flow regimes in parts of West Africa where long-term mean yields of freshwater fell by 18% between 1951–70 and 1971–89 relating to prolonged drying in the Sahel. During the period 1961–90 (1931–60), rainfall explains 60%– 80% (40%–60%) of the variability in river flows in West Africa.

In contrast, East Africa  has experienced relative climatic stability punctuated by extreme wet years with prolonged periods of high river flows associated with the El Nino–Southern Oscillation (ENSO), particularly during the short October–December rains. This intense rainfall has been found to contribute disproportionately to recharge with suggestions that increased use of groundwater  may therefore prove a potentially viable adaptation to enhanced variability in surface-water resources and soil moisture resulting from climate change (Taylor et al. 2012). As Conway et al. conclude, rainfall provides the dominant control on surface water flows and is key in determining the availability on annual renewable freshwater resources.

A study by Mahe (2009) found that although rainfall has decreased in West Africa for two river basins (Bani and Nakambe) since the 1970's the actual discharge of  the rivers has altered significantly. Despite rainfall falling 16% and 19% respectively river discharge reduced significantly within the Bani river but increased within the Nakambe river. Bani low flow variability is well correlated to a decrease in the water table resulting from climatic changes. However, for the Nakambe basin increased flows result from land degradation driven by human activity creating higher runoff coefficients. This could potentially in the long run create land that is no longer suitable for agriculture. Again, physical factors determine the underlying availability of renewable freshwater resources.

The importance of distribution is also echoed by Taylor (2004) who argues that the difference between the distribution of water resource and demand for them currently impedes development within Africa and will likely continue to do so into the future even within countries that on a national scale have adequate water resources. For instance despite Namibia's relatively significant quantity of renewable water resources (fig.1), river flow is highly seasonal and confined to its borders (Orange river, Cunene and Cubango) with poor groundwater resources. This builds upon the wider debate (future blog post) that metrics that define resources fail to acknowledge physical spatial and temporal distribution which is critical for access.

Figure 1: Estimated renewable water resources, water use
and per capita availability within Africa. Credit: Taylor (2004).


A further physical characteristic that can determine the availability of water is the tectonic setting of a region. Evidence from Uganda shows how in central Uganda deep weathering accompanying long term tectonic stability results in a recharge-dominated regime with a large basin storage ensuring water availability despite highly seasonal rainfall. On the other hand, stripping of the land surface in south western Uganda resulting from tectonic uplift has resulted in a comparatively low storage component. Stream flow is highly variable and confined to incised channels creating problems for water availability. Again the distribution and availability of water resources is determined by the physical characteristics of the region.

The use of groundwater within Africa for domestic use and for irrigation is expected to increase significantly over coming years as a result of rising population and irrigation growth. MacDonald et al. (2012) estimated total groundwater storage in Africa to be 0.66 million km3 or more than 100 times estimates of annual renewable freshwater resources within Africa. Not only are reserves extensive but groundwater also provides an important buffer to the seasonality and unpredictability of rainfall and changes in climate. Many countries considered 'water scarce' by traditional metrics have significant groundwater reserves beneath them. However, once again water resources are not equally distributed, neither are they equally accessible. Figure 2 highlights the large groundwater volumes available within Northern Africa, recognised above as an area experiencing prolonged drying. Although these aquifers can sustain high levels of irrigation (5 l s-1_ they were found to be distributed away from population concentrations and at significant depth (fig. 2) making them costly to exploit.
Figure 2: Aquifer productivity for Africa as well as estimated depth to groundwater. Credit: MacDonald et al. 2012

However, a significant finding of MacDonald et al. was that the distribution of aquifers within Africa could facilitate widespread small scale community hand pumps (yields of 0.1-0.3 l s-1) with a smaller but significant number of intermediate boreholes sustaining small scale household and community irrigation (0.5-5 l s-1). These findings suggest a need to shift away from large scale top down responses to water scarcity to smaller scale, community based bottom up approaches which sustainably use the available resources within Africa.

The importance of physical factors is reinforced by the leading image of Lusaka. The high presence of pivot irrigation to the north of the map symbolizes how the availability of annual renewable freshwater resources resulting from physical factors, such as a highly productive aquifer in this case, can go a long way in ensuring access to safe freshwater in urban areas. In addition, the prospect of preferentially increasing temperatures, intensification of precipitation with knock on effects on river discharge and rising populations will likely further exaggerate the role of physical factors in determining access to water in urban areas. Nevertheless, it would be incredibly naive to argue that only physical factors were responsible in determining access. Water availability by no means ensures access. My next blog will analyse the socio-economic factors that are also vitally important.

Friday, 16 October 2015

Urban water within Africa - Context

Sustainable Development Goals: the follow on from the Millennium
Development Goals includes a new goal focused on clean water and sanitation.
Hello!

Welcome to my first blog (of hopefully many) this term which will be investigating urban water and sanitation with a specific focus on Africa. This is all part of a 3rd year undergraduate course at UCL titled ‘Water and Development in Africa’.

Over the term I will address key themes surrounding urban water and sanitation including and not limited to:
  • Water distribution, availability and access
  • Types of water usage
  • Piped vs unpiped supplies 
  • Reliability of water supplies
  • Issues of sanitation and health
  • How people pay for water
  • Issues of management, infrastructure and governance.
But where is better to start than with a little context:

Water and sanitation is a highly topical subject following the adoption of the Sustainable Development Goals (SDGs) in August this year. They replaced the Millennium Development Goals and include a new goal entirely focused on clean water and sanitation. The goal itself is to 'Ensure availability and sustainable management of water and sanitation for all'.  Within this there are a further 8 targets, all of which appear ambitious. For instance 6.1 requires by 2030 'universal and equitable access to safe and affordable drinking water for all'.

These targets need to be ambitious. Studies have shown that urban water supplies deteriorated in East Africa over a 30 year period from 1967-1997. For sites that had piped water in 1967 most received less water per day in 1997 and had more unreliable supplies. For households without piped supplies, the average time spent collecting water in 1997 was more than three times that in 1967 (Thompson et al., 2000). Furthermore, the rates of urban populations enjoying piped water supply at or within the home remains low (Howard et al., 2002).

Recent WHO/UNICEF regional figures give of a more positive light. Northern Africa for instance in 2015 has 95% access to improved drinking water sources in urban areas. Sub-Saharan Africa increased marginally from 83% in 1990 to 87% in 2015. However these figures still seem low when compared to developed regions which enjoy 100% access. Furthermore, Angola, Equatorial Guinea, Chad and Eritrea all have less than 75% urban access to improved sources. For South Sudan this figure is lower at 67% and in Mauritania it is just 58%. In addition, as will be discussed in a later blog availability of water resources whether improved or not does not equate to access to freshwater. Coupled with climate change and population growth, issues surrounding urban water and sanitation appear as real as ever. The number of people living under conditions of water scarcity is projected to double or triple within the next 40 years to between 3 and 7 billion (Taylor, 2009).

Therefore, regardless of the fact that the new SDGs have attracted criticism as part of wider debates, it must be beneficial that water and sanitation are now a documented focus within an agreed inter-governmental set of targets. Only time will tell if improvements can be made.

Next week I will begin by investigating the availability of water in urban areas.

Finally, I would love my blog to be interactive with its readers. Please feel free to comment with points or issues with what I have raised and highlight anything I may have missed. If there is anything or anywhere you think I should research let me know!